Individuals have from 1 July to 31 October each year to lodge their tax return, unless it is prepared by a registered tax agent. Some individuals are not required to lodge a tax return.
The Individuals section contains the following tables and graphs:
- Table 4: Returns by lodgment type, 2008–09 to 2012–13 income years
- Table 5: Returns by tax status, 2008–09 to 2012–13 income years
- Table 6: Returns by gender, 2008–09 2012–13 income years
- Table 7: Returns by state or territory, 2008–09 2012–13 income years
- Table 8: Returns by age, 2008–09 to 2012–13 income years
- Table 9: Selected income items, 2010–11 to 2012–13 income years
- Table 10: Selected deductions, 2010–11 to 2012–13 income years
- Table 11: Gifts or donations, by amount, 2010–11 to 2012–13 income years
- Table 12: Workplace giving programs, 2010–11 to 2012–13 income years
- Table 13: Rental income and deductions, 2010–11 to 2012–13 income years
- Table 14: Selected tax offsets and levies, 2010–11 to 2012–13 income years
- Table 15: Net tax by tax bracket, 2012–13 income year
- Figure 4: Number of individuals and net tax, by tax bracket, 2012–13 income year
- Table 16: Tax refund or debit assessment for individuals, 2010–11 to 2012–13 income years
As well as these tables, we have a set of more detailed tables available in the form of Excel spreadsheets containing individuals data at a much finer level. You can also use the national map to view the average taxable income of taxable individuals.
Find out more
Data for each income year includes data processed up to 31 October of the following year. For example, data for the 2012–13 income year includes data processed up to 31 October 2014.
The number of individuals has been rounded to the nearest five and totals may differ from the sum of components, due to rounding.
Table 4: Individuals – returns by lodgment type, 2008–09 to 2012–13 income years
|
2008–09
|
2009–10
|
2010–11
|
2011–12
|
2012–13
|
Agent
|
8,757,810
|
8,786,515
|
9,033,880
|
9,225,745
|
9,392,850
|
e-tax
|
2,313,700
|
2,351,240
|
2,505,905
|
2,598,080
|
2,836,115
|
Other self-preparer
|
1,220,205
|
1,242,275
|
1,097,840
|
912,205
|
547,100
|
Total
|
12,291,715
|
12,380,030
|
12,637,625
|
12,736,030
|
12,776,065
|
Table 5: Individuals – returns by tax status, 2008–09 to 2012–13 income years
|
2008–09
|
2009–10
|
2010–11
|
2011–12
|
2012–13
|
Taxable
|
9,188,805
|
9,105,965
|
9,416,000
|
9,799,820
|
9,476,960
|
Non-taxable
|
3,102,910
|
3,274,060
|
3,221,620
|
2,936,210
|
3,299,105
|
Total
|
12,291,715
|
12,380,030
|
12,637,625
|
12,736,030
|
12,776,065
|
Table 6: Individuals – returns by gender, 2008–09 to 2012–13 income years
|
2008–09
|
2009–10
|
2010–11
|
2011–12
|
2012–13
|
Male
|
6,335,060
|
6,380,735
|
6,513,155
|
6,626,820
|
6,663,920
|
Female
|
5,956,655
|
5,999,295
|
6,124,465
|
6,109,210
|
6,112,145
|
Total
|
12,291,715
|
12,380,030
|
12,637,625
|
12,736,030
|
12,776,065
|
Table 7: Individuals – returns by state or territory, 2008–09 to 2012–13 income years
|
2008–09
|
2009–10
|
2010–11
|
2011–12
|
2012–13
|
NSW
|
3,918,125
|
3,932,960
|
4,006,175
|
4,007,855
|
4,008,285
|
VIC
|
3,041,490
|
3,079,930
|
3,144,655
|
3,164,545
|
3,173,575
|
QLD
|
2,487,535
|
2,486,910
|
2,530,955
|
2,555,375
|
2,558,465
|
WA
|
1,310,255
|
1,327,710
|
1,366,340
|
1,416,635
|
1,448,000
|
SA
|
901,335
|
906,895
|
918,130
|
914,330
|
907,765
|
TAS
|
276,830
|
276,305
|
278,340
|
272,435
|
267,035
|
ACT
|
224,615
|
227,855
|
233,140
|
238,125
|
240,410
|
NT
|
111,930
|
110,835
|
115,610
|
119,680
|
121,625
|
Unknown
|
19,600
|
30,630
|
44,280
|
47,045
|
50,895
|
Total
|
12,291,715
|
12,380,030
|
12,637,625
|
12,736,030
|
12,776,065
|
Table 8: Individuals – returns by age, 2008–09 to 2012–13 income years
|
2008–09
|
2009–10
|
2010–11
|
2011–12
|
2012–13
|
Under 18
|
234,140
|
208,185
|
204,420
|
172,795
|
125,670
|
18 – 24
|
1,633,135
|
1,603,630
|
1,616,395
|
1,605,485
|
1,539,645
|
25 – 29
|
1,312,930
|
1,348,800
|
1,398,860
|
1,423,280
|
1,432,395
|
30 – 34
|
1,233,750
|
1,245,205
|
1,288,090
|
1,319,405
|
1,364,535
|
35 – 39
|
1,341,380
|
1,333,480
|
1,319,115
|
1,280,020
|
1,271,030
|
40 – 44
|
1,263,020
|
1,275,515
|
1,318,835
|
1,337,210
|
1,358,155
|
45 – 49
|
1,296,940
|
1,291,185
|
1,285,580
|
1,263,875
|
1,253,795
|
50 – 54
|
1,158,235
|
1,179,500
|
1,207,890
|
1,231,705
|
1,251,645
|
55 – 59
|
994,125
|
1,006,220
|
1,029,555
|
1,053,760
|
1,071,405
|
60 – 64
|
768,595
|
800,820
|
835,730
|
843,070
|
853,980
|
65 – 69
|
410,570
|
432,610
|
458,120
|
506,920
|
541,055
|
70 – 74
|
246,140
|
253,710
|
262,895
|
274,880
|
282,625
|
75 & over
|
398,750
|
401,170
|
412,140
|
423,630
|
430,140
|
Total
|
12,291,715
|
12,380,030
|
12,637,625
|
12,736,030
|
12,776,065
|
Table 9: Individuals selected income items, 2010–11 to 2012–13 income years
|
2010–11
|
2011–12
|
2012–13
|
no.
|
$m
|
no.
|
$m
|
no.
|
$m
|
Salary and wages
|
9,932,610
|
499,336
|
10,144,475
|
535,574
|
10,167,005
|
563,690
|
Net partnership and trust distributions – non-primary production
|
1,938,920
|
43,611
|
1,825,245
|
46,458
|
1,793,840
|
47,993
|
Net business income – non-primary production
|
1,013,075
|
25,012
|
1,026,020
|
25,998
|
1,045,760
|
26,641
|
Dividends franked
|
3,009,195
|
19,973
|
2,955,010
|
19,899
|
2,932,595
|
20,810
|
Gross interest
|
6,784,815
|
15,269
|
7,147,550
|
16,973
|
7,170,155
|
15,045
|
Net capital gains
|
557,015
|
11,619
|
424,320
|
9,188
|
505,750
|
9,874
|
Franking credits
|
2,991,930
|
8,553
|
2,943,085
|
8,521
|
2,922,125
|
8,910
|
Allowances, benefits, earnings and tips
|
2,243,510
|
7,696
|
2,293,225
|
8,263
|
2,268,290
|
8,590
|
Commonwealth of Australia pensions and allowances
|
698,750
|
6,294
|
693,705
|
6,458
|
670,690
|
6,263
|
Other sources of income
|
na
|
32,530
|
na
|
34,476
|
na
|
35,214
|
Net rent
|
1,811,175
|
-7,862
|
1,895,775
|
-7,860
|
1,967,260
|
-5,394
|
Total income
|
na
|
662,032
|
na
|
703,947
|
na
|
738,726
|
Notes:Other sources of income: this includes all income labels from the Income section of the Individual income tax return form not listed in the table.Total income: components do not add to the total number of taxpayers because taxpayers may declare more than one type of income.
Table 10: Individuals – selected deductions, 2010–11 to 2012–13 income years
|
2010–11
|
2011–12
|
2012–13
|
|
no.
|
$m
|
no.
|
$m
|
no.
|
$m
|
Work-related expenses
|
8,333,960
|
18,270
|
8,549,065
|
19,358
|
8,514,345
|
19,761
|
Personal superannuation contributions
|
188,615
|
4,233
|
185,860
|
4,400
|
183,975
|
2,909
|
Cost of managing tax affairs
|
5,930,500
|
2,125
|
6,128,240
|
2,276
|
6,201,835
|
2,351
|
Gifts or donations
|
4,793,775
|
2,212
|
4,536,370
|
2,242
|
4,548,810
|
2,293
|
Other deductions
|
646,295
|
1,560
|
678,725
|
1,458
|
675,210
|
1,688
|
Dividends deductions
|
301,600
|
1,577
|
285,095
|
1,394
|
268,670
|
1,212
|
Interest deductions
|
481,785
|
1,299
|
437,125
|
1,144
|
370,655
|
917
|
Other deduction labels
|
na
|
242
|
na
|
445
|
na
|
253
|
Total deductions
|
na
|
31,520
|
na
|
32,718
|
na
|
31,383
|
Notes:Other deduction labels: this includes all deduction labels from the Deductions section of the Individual income tax return form not listed in the table.Total deductions: components do not add to the total number of taxpayers claiming deductions because taxpayers may claim more than one type of deduction.
Table 11: Individuals – gifts or donations, by amount, 2010–11 to 2012–13 income years
Gifts or donations claimed
|
2010–11
|
2011–12
|
2012–13
|
no.
|
$m
|
no.
|
$m
|
no.
|
$m
|
$1 – $25
|
1,102,095
|
16
|
875,985
|
13
|
884,175
|
13
|
$26 – $50
|
800,215
|
34
|
801,010
|
34
|
767,615
|
33
|
$51 – $250
|
1,566,790
|
201
|
1,543,850
|
198
|
1,542,420
|
199
|
$251 – $1,000
|
1,001,350
|
512
|
995,910
|
508
|
1,021,025
|
522
|
$1,001 – $5,000
|
284,400
|
539
|
280,600
|
532
|
292,825
|
555
|
$5,001 – $10,000
|
24,320
|
165
|
24,295
|
165
|
25,070
|
171
|
$10,001 – $25,000
|
10,225
|
150
|
10,210
|
150
|
10,915
|
160
|
More than $25,000
|
4,375
|
595
|
4,515
|
641
|
4,765
|
640
|
Total
|
4,793,775
|
2,212
|
4,536,370
|
2,242
|
4,548,810
|
2,293
|
Table 12: Individuals – workplace giving programs, 2010–11 to 2012–13 income years
|
2010–11
|
2011–12
|
2012–13
|
Total number of employees employed by workplace giving employers (no.)
|
3,158,980
|
2,813,915
|
2,928,725
|
Number of employees using workplace giving (no.)
|
157,385
|
130,754
|
141,910
|
Total donations given using workplace giving ($m)
|
30
|
27
|
28
|
Note: The 2010-11 and 2011-12 figures have been updated:
Table 13: Individuals – rental income and deductions, 2010–11 to 2012–13 income years
|
2010–11
|
2011–12
|
2012–13
|
|
no.
|
$m
|
no.
|
$m
|
no.
|
$m
|
Gross rental income
|
1,788,690
|
30,730
|
1,873,210
|
34,000
|
1,944,080
|
36,593
|
Rental interest deductions
|
1,459,530
|
22,670
|
1,532,300
|
24,178
|
1,591,610
|
22,548
|
Capital works deductions
|
734,565
|
1,921
|
798,075
|
2,167
|
857,975
|
2,440
|
Other rental deductions
|
1,795,705
|
14,002
|
1,880,845
|
15,531
|
1,952,530
|
16,998
|
Net rental income
|
1,811,175
|
-7,862
|
1,895,775
|
-7,860
|
1,967,260
|
-5,394
|
Note: Net rental income: components do not add to the total number of taxpayers because taxpayers may claim more than one type of deduction.
Table 14: Individuals – selected tax offsets and levies, 2010–11 to 2012–13 income years
|
2010–11
|
2011–12
|
2012–13
|
|
no.
|
$m
|
no.
|
$m
|
no.
|
$m
|
Low income tax offset
|
8,443,790
|
8,495
|
8,329,895
|
8,131
|
6,503,930
|
2,066
|
Termination payment tax offset
|
155,895
|
844
|
181,475
|
1,102
|
335,870
|
1,195
|
Seniors and pensioners tax offset
|
634,560
|
949
|
635,890
|
949
|
603,640
|
735
|
Foreign income tax offset
|
568,500
|
486
|
599,595
|
562
|
592,255
|
667
|
Australian superannuation income stream tax offset
|
245,350
|
634
|
217,070
|
567
|
212,700
|
564
|
Mature age worker tax offset
|
1,368,745
|
572
|
1,072,205
|
458
|
909,800
|
385
|
Medical expenses tax offset
|
802,065
|
567
|
801,585
|
600
|
598,285
|
377
|
Medicare levy
|
8,660,715
|
8,474
|
8,957,560
|
9,072
|
8,969,035
|
9,522
|
Medicare levy surcharge
|
209,770
|
188
|
219,495
|
206
|
199,295
|
249
|
Note: Seniors and pensioners tax offset: for the 2010–11 and 2011–12 income years, these figures relate to the Senior Australians tax offset.
Table 15: Individuals – net tax, by tax bracket, 2012–13 income year
Taxable income
|
Individuals
|
Net tax
|
|
no.
|
%
|
$m
|
%
|
$18,200 or less
|
2,532,645
|
19.8
|
79
|
0.1
|
$18,201 – $37,000
|
3,102,005
|
24.3
|
4,178
|
2.7
|
$37,001 – $80,000
|
4,775,060
|
37.4
|
46,905
|
30.3
|
$80,001 – $180,000
|
2,026,370
|
15.9
|
60,380
|
39.0
|
$180,001 or more
|
339,985
|
2.7
|
43,341
|
28.0
|
Total
|
12,776,065
|
100.0
|
154,880
|
100.0
|
Figure 4. Number of individuals and net tax, by tax bracket, 2012–13 income year
These charts show the percentage of individuals earning income within each tax bracket and the contribution these individuals make towards individual income net tax.
Number of individuals Amount of net tax
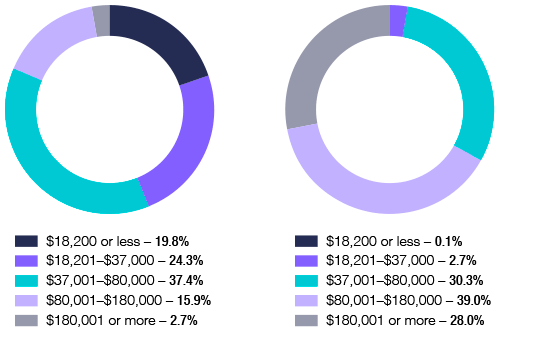
Table 16: Individuals – tax refunds and debit assessments, 2010–11 to 2012–13 income years
Refund or debit
|
2010–11
|
2011–12
|
2012–13
|
|
no.
|
$m
|
no.
|
$m
|
no.
|
$m
|
Refund of $10,000 or more
|
259,105
|
-4,837
|
299,540
|
-5,665
|
303,665
|
-5,663
|
Refund between $8,000 and $9,999
|
158,615
|
-1,408
|
178,430
|
-1,585
|
209,115
|
-1,854
|
Refund between $6,000 and $7,999
|
353,235
|
-2,420
|
387,820
|
-2,658
|
468,730
|
-3,229
|
Refund between $4,000 and $5,999
|
832,180
|
-4,055
|
834,305
|
-4,082
|
823,605
|
-4,021
|
Refund between $2,000 and $3,999
|
2,224,975
|
-6,238
|
2,052,095
|
-5,782
|
2,025,835
|
-5,703
|
Refund between $1 and $1,999
|
6,565,650
|
-5,946
|
6,533,720
|
-5,537
|
6,431,335
|
-5,329
|
Total refunds
|
10,393,760
|
-24,905
|
10,285,915
|
-25,310
|
10,262,290
|
-25,800
|
No refund or debit
|
603,755
|
0
|
666,920
|
0
|
731,725
|
0
|
Debit between $1 and $1,999
|
845,430
|
632
|
952,460
|
698
|
957,105
|
681
|
Debit between $2,000 and $3,999
|
273,490
|
787
|
294,920
|
847
|
286,320
|
822
|
Debit between $4,000 and $5,999
|
132,050
|
648
|
139,520
|
685
|
136,075
|
668
|
Debit between $6,000 and $7,999
|
81,475
|
565
|
85,495
|
593
|
85,560
|
593
|
Debit between $8,000 and $9,999
|
56,780
|
508
|
58,190
|
521
|
57,740
|
516
|
Debit of $10,000 or more
|
250,885
|
9,965
|
252,615
|
9,413
|
259,250
|
9,860
|
Total debits
|
1,640,110
|
13,105
|
1,783,195
|
12,757
|
1,782,050
|
13,141
|
Total
|
12,637,625
|
-11,800
|
12,736,030
|
-12,553
|
12,776,065
|
-12,659
|