Individuals, companies, superannuation funds (including self-managed funds), partnerships and trusts are all required to lodge an income tax return each year.
This section contains tables relating to
Data for each income year includes data processed up to 31 October of the following year. For example, data for the 2011–12 income year includes data processed up to 31 October 2013.
The number of entities has been rounded to the nearest five and totals may differ from the sum of components, due to rounding.
We also have a set of detailed summary tables available including overviews of the individual and company tax systems, a snapshot of various taxation information at the broad industry level, and all of the summary tables in Excel format.
Find out more
Detailed summary tables
Table 1: Tax return lodgment, by entity, 2009–10 to 2011–12 income years
Entity
|
2009–10
|
2010–11
|
2011–12
|
Individual
|
12,380,030
|
12,637,625
|
12,736,030
|
Company
|
779,250
|
788,985
|
817,885
|
Self-managed super fund
|
373,195
|
391,165
|
424,360
|
APRA and other funds
|
4,500
|
4,100
|
3,695
|
Partnership
|
382,400
|
370,000
|
359,905
|
Trust
|
702,080
|
729,620
|
753,730
|
Total
|
14,621,445
|
14,921,490
|
15,095,605
|
Note- APRA and other funds: includes funds regulated by the Australian Prudential Regulation Authority, funds that nominated ‘other’ on their tax return, and non-regulated funds.Figure 1. Taxpayer growth by entity, 2007–08 to 2011–12 income years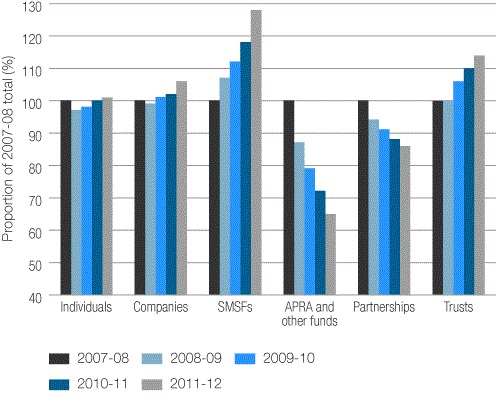
The size of an entity is determined by the amount of business income received.
Table 2: Size of entities, 2011–12 income year
Entity size
|
Individuals
|
Companies
|
Super funds
|
Partnerships
|
Trusts
|
Total
|
Loss
|
1,400
|
1,790
|
35
|
275
|
735
|
4,235
|
Nil
|
11,668,330
|
110,405
|
59,290
|
69,170
|
436,105
|
12,343,300
|
Micro
|
1,062,640
|
635,150
|
368,410
|
281,690
|
290,480
|
2,638,375
|
Small
|
3,285
|
53,805
|
120
|
7,615
|
22,070
|
86,900
|
Medium
|
360
|
14,535
|
100
|
1,050
|
4,150
|
20,200
|
Large
|
10
|
1,185
|
40
|
65
|
150
|
1,450
|
Very large
|
0
|
1,010
|
60
|
40
|
35
|
1,150
|
Total
|
12,736,030
|
817,885
|
428,055
|
359,905
|
753,730
|
15,095,605
|
Figure 2. Income net tax by entity, 2007–08 to 2011–12 income years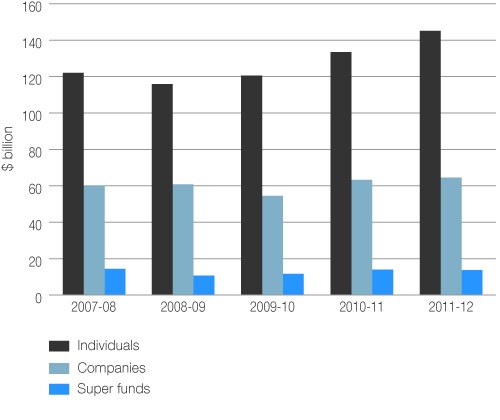
Note- The net tax for 2007–08 to 2010–11 income years for companies and funds has been updated to be consistent with the new definition of net tax.Find out more
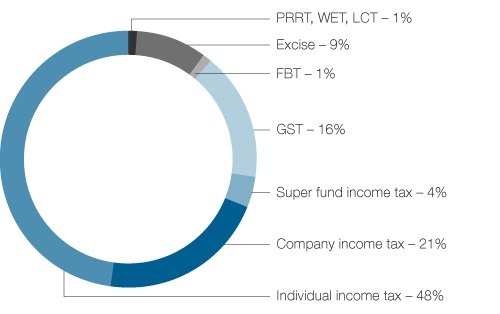
Table 3: Taxation liabilities, by industry, 2011–12 income year
Industry
|
Individuals $m
|
Company $m
|
Fund $m
|
FBT $m
|
GST $m
|
Excise, PRRT, LCT and WET $m
|
Total $m
|
Agriculture, forestry and fishing
|
138
|
410
|
|
18
|
158
|
25
|
749
|
Mining
|
18
|
15,149
|
|
272
|
-9,139
|
2,472
|
8,772
|
Manufacturing
|
125
|
3,882
|
|
397
|
6,639
|
11,277
|
22,321
|
Electricity, gas, water and waste services
|
8
|
324
|
|
60
|
748
|
570
|
1,710
|
Construction
|
828
|
2,717
|
|
148
|
7,018
|
<1
|
10,711
|
Wholesale trade
|
37
|
6,355
|
|
380
|
13,142
|
11,742
|
31,655
|
Retail trade
|
197
|
3,351
|
|
167
|
3,841
|
1,938
|
9,494
|
Accommodation and food services
|
38
|
644
|
|
37
|
3,366
|
2
|
4,086
|
Transport, postal and warehousing
|
159
|
1,622
|
|
115
|
2,824
|
256
|
4,976
|
Information media and telecommunications
|
40
|
2,613
|
|
100
|
2,666
|
<1
|
5,419
|
Financial and insurance services
|
57
|
18,258
|
|
340
|
6,503
|
229
|
38,751
|
Rental, hiring and real estate services
|
71
|
2,102
|
|
65
|
4,197
|
<1
|
6,436
|
Professional, scientific and technical services
|
1,179
|
3,802
|
|
351
|
9,116
|
27
|
14,475
|
Administrative and support services
|
134
|
826
|
|
135
|
3,586
|
1
|
4,681
|
Public administration and safety
|
16
|
98
|
|
655
|
-10,699
|
1
|
-9,929
|
Education and training
|
58
|
182
|
|
161
|
83
|
1
|
485
|
Health care and social assistance
|
2,412
|
817
|
|
62
|
-1,799
|
<1
|
1,493
|
Arts and recreation services
|
101
|
353
|
|
45
|
899
|
<1
|
1,398
|
Other services
|
208
|
471
|
|
96
|
1,832
|
2
|
2,610
|
Other
|
230
|
175
|
|
101
|
-1,235
|
84
|
-859
|
Industry total
|
6,056
|
64,152
|
|
3,706
|
43,745
|
28,626
|
298,370
|
Other income tax
|
138,935
|
|
13,365
|
|
|
|
|
Total ATO collections
|
144,776
|
64,152
|
13,365
|
3,706
|
43,745
|
28,626
|
298,370
|
Customs collections
|
|
|
|
|
3,062
|
32
|
3,094
|
Total with Customs
|
144,776
|
64,152
|
13,365
|
3,706
|
46,807
|
28,658
|
301,464
|
Notes- Title abbreviations: goods and services tax (GST), fringe benefits tax (FBT), petroleum resource rent tax (PRRT), luxury car tax (LCT) and wine equalisation tax (WET).Industry groups: these are based on the Australian and New Zealand Standard Industrial Classification (ANZSIC) 2006 codes reported on the Australian Business Register. ‘Other’ includes entities not recorded in above groups.Public administration and safety: the FBT reported includes FBT from Australian Government departments.Other income tax: this includes non-business income tax for individuals, such as tax on salary and wage income, or tax on investments only and all super fund income tax, which do not fit into an industry split.Figure 3. Taxation liabilities by source, 2011–12 income year