For income tax purposes, a company is a body corporate or any unincorporated association or body of persons, but does not include a partnership and a non-entity joint venture. For income tax purposes, the term 'companies' may represent a consolidated group of companies, rather than a single entity.
Companies are considered taxable if they have net tax of more than $0. This year's company statistics include information on the International dealings schedule for the first time.
The Companies section contains the following tables and graphs
- Table 17: Returns by taxable status, 2009–10 to 2011–12 income years
- Table 18: Selected income items, 2009–10 to 2011–12 income years
- Table 19: Selected expenses, 2009–10 to 2011–12 income years
- Table 20: Net tax, by company size, 2009–10 to 2011–12 income years
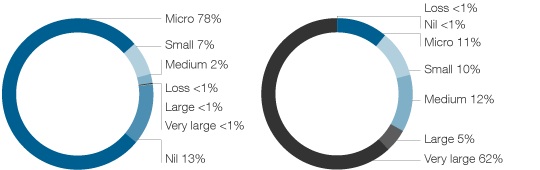
- Figure 5. Number of companies and net tax by size, 2011–12 income year
- Table 21: International revenue, by country, 2011–12 income year
- Table 22: International expenditure, by country, 2011–12 income year
We also have a set of more detailed tables available in the form of Excel spreadsheets containing company data at a much finer level.
Find out more
Data for each income year includes data processed up to 31 October of the following year. For example, data for the 2011–12 income year includes data processed up to 31 October 2013.
The number of companies has been rounded to the nearest five and totals may differ from the sum of components, due to rounding.
Table 17: Companies – returns by taxable status, 2009–10 to 2011–12 income years
Taxable status
|
2009–10
|
2010–11
|
2011–12
|
no.
|
%
|
no.
|
%
|
no.
|
%
|
Non-taxable companies
|
474,630
|
60.9
|
465,555
|
59.0
|
480,845
|
58.8
|
Taxable companies
|
304,620
|
39.1
|
323,425
|
41.7
|
337,035
|
41.2
|
Total
|
779,250
|
100.0
|
788,985
|
100.0
|
817,885
|
100.0
|
Table 18: Companies – selected income items, 2009–10 to 2011–12 income years
Item
|
2009–10
|
2010–11
|
2011–12
|
no.
|
$m
|
no.
|
$m
|
no.
|
$m
|
Sales of goods and services
|
288,435
|
1,640,268
|
293,570
|
1,759,014
|
305,265
|
1,878,319
|
Other gross income
|
323,590
|
298,723
|
331,375
|
323,778
|
343,495
|
307,804
|
Gross interest
|
396,980
|
184,824
|
416,945
|
207,632
|
423,665
|
214,888
|
Gross dividends
|
53,425
|
30,410
|
52,520
|
42,779
|
51,725
|
41,670
|
Gross rents/leasing/hiring
|
65,240
|
36,408
|
65,055
|
37,343
|
66,575
|
41,089
|
Income from financial arrangements (TOFA)
|
60
|
258
|
225
|
17,459
|
595
|
30,080
|
Gross distribution from trusts
|
61,950
|
27,022
|
59,210
|
28,283
|
59,300
|
29,366
|
Unrealised gains on revaluation of assets to fair value
|
1,765
|
28,223
|
1,645
|
11,281
|
1,350
|
17,910
|
Other income items
|
na
|
9,394
|
na
|
12,002
|
na
|
12,013
|
Total income
|
668,240
|
2,255,529
|
680,075
|
2,439,573
|
707,480
|
2,573,139
|
Notes- Other income items: this includes all income labels from the Income section of the Company income tax return form not listed in the table.Total income: components do not add to the number of companies as companies may declare more than one type of income.
Table 19: Companies – selected expenses, 2009–10 to 2011–12 income years
Expense
|
2009–10
|
2010–11
|
2011–12
|
no.
|
$m
|
no.
|
$m
|
no.
|
$m
|
Cost of sales
|
242,495
|
975,600
|
246,685
|
1,030,367
|
255,575
|
1,091,057
|
Other expenses
|
690,870
|
625,632
|
703,035
|
666,200
|
730,790
|
716,634
|
Interest expenses within Australia
|
297,270
|
136,052
|
296,010
|
150,535
|
304,095
|
154,900
|
Contractor/subcontractor and commission expenses
|
148,245
|
78,900
|
152,175
|
86,017
|
157,250
|
96,016
|
Depreciation expenses
|
446,885
|
62,601
|
451,600
|
66,271
|
463,385
|
70,501
|
Rent expenses
|
227,430
|
36,800
|
233,195
|
42,690
|
242,905
|
42,415
|
Interest expenses overseas
|
9,560
|
27,476
|
9,720
|
31,221
|
10,395
|
31,836
|
Employee superannuation
|
320,940
|
25,791
|
325,515
|
27,234
|
334,560
|
29,257
|
Other expense items
|
na
|
86,465
|
na
|
100,564
|
na
|
111,764
|
Total expenses
|
699,760
|
2,055,317
|
711,370
|
2,201,100
|
739,165
|
2,344,380
|
Notes-Other expense items: this includes all expense items from the Expenses section of the Company income tax return form not listed in the table.Total expenses: components do not add to the number of companies as companies may declare more than one type of income.
Table 20: Companies – net tax by company size, 2009–10 to 2011–12 income years
Company size
|
2009–10
|
2010–11
|
2011–12
|
no.
|
Net tax $m
|
no.
|
Net tax $m
|
no.
|
Net tax $m
|
Loss
|
1,826
|
2
|
1,670
|
<1
|
1,790
|
11
|
Nil
|
111,010
|
127
|
108,910
|
42
|
110,405
|
76
|
Micro
|
601,695
|
6,023
|
610,520
|
6,588
|
635,150
|
7,018
|
Small
|
49,610
|
5,258
|
51,960
|
6,028
|
53,805
|
6,394
|
Medium
|
13,050
|
7,459
|
13,805
|
7,652
|
14,540
|
7,730
|
Large
|
1,115
|
2,899
|
1,155
|
3,302
|
1,185
|
2,951
|
Very large
|
940
|
32,449
|
960
|
39,410
|
1,010
|
39,972
|
Total
|
779,250
|
54,217
|
788,985
|
63,023
|
817,885
|
64,152
|
Note- The net tax for 2009–10 and 2010–11 income years has been updated to be consistent with the new definition of net tax.Find out more
Changes to the definition of net tax for this year
Figure 5. Number of companies and net tax, by size, 2011–12 income year
These charts show the percentage of companies within each entity size grouping and the contribution those companies make towards company income net tax.
Number of companies Amount of net tax
The international dealings schedule was introduced in the 2011–12 income year, replacing the previous Schedule 25A and Thin capitalisation schedule, and captures data about international transactions. Due to the structure of this new schedule, the counts in the tables below should be seen as indicative only.
For the 2011–12 income year, a total of 7,680 companies lodged an international dealings schedule, approximately 1% of all companies.
Table 21: Companies – international revenue, by country, 2011–12 income year
Country
|
No.
|
Revenue $m
|
Switzerland
|
105
|
35,343
|
United States
|
1,485
|
11,679
|
Singapore
|
705
|
11,385
|
United Kingdom
|
920
|
6,869
|
New Zealand
|
1,430
|
5,637
|
Japan
|
260
|
4,825
|
Other
|
na
|
23,639
|
Total
|
na
|
99,377
|
Table 22: Companies – international expenditure, by country, 2011–12 income year
Country
|
No.
|
Expenditure $m
|
Singapore
|
905
|
41,386
|
United States
|
1,975
|
13,869
|
Japan
|
380
|
12,145
|
United Kingdom
|
1,220
|
11,851
|
Germany
|
415
|
7,401
|
Ireland
|
90
|
4,491
|
Other
|
na
|
34,504
|
Total
|
na
|
125,646
|