The Individuals section includes statistics on most labels and calculations from the Individuals tax return, as well as some superannuation account information.
Individuals summary tables and charts
- Table 3: Individuals – median and average key items, by sex – over 2 years
- Chart 4: Individuals – top 10 postcodes, by average taxable income
- Chart 5: Individuals – top 10 occupations, by average taxable income
- Table 4: Individuals – private health insurance, by family status, income tier and age
- Chart 6: Individuals – net tax, by tax bracket
- Table 5: Individuals – selected income items – over 2 years
- Table 6: Individuals – selected deductions – over 2 years
- Table 7: Individuals – selected tax offsets and levies – over 2 years
- Chart 7: Individuals – returns by lodgment type
- Chart 8: Individuals – returns by sex – over 5 years
- Chart 9: Individuals – returns by state/territory
- Chart 10: Individuals – rental income and deductions – over 5 years
- Table 8: Individuals – interest in a rental property, by overall net rent outcome – over 2 years
- Chart 11: Individuals – gifts or donations by state/territory
- Table 9: Individuals – workplace giving programs – over 3 years
- Chart 12: Individuals – median super balance, by age and sex
- Chart 13: Individuals – super balance, by state/territory and sex
- Table 10: Individuals – super balance, by taxable income range – over 2 years
Table 3: Individuals – median and average key items, by sex, 2018–19 and 2019–20 income years
|
2018–19
|
2019–20
|
Male
|
Female
|
Total
|
Male
|
Female
|
Total
|
Average taxable income
($)
|
73,218
|
51,382
|
62,549
|
74,559
|
52,798
|
63,882
|
Median taxable income
($)
|
55,829
|
40,547
|
47,492
|
56,746
|
41,724
|
48,381
|
Average net tax
($)
|
23,365
|
14,687
|
19,344
|
23,938
|
15,079
|
19,790
|
Median net tax
($)
|
13,801
|
8,405
|
11,024
|
14,185
|
8,697
|
11,330
|
Average superannuation account balance
($)
|
162,275
|
128,068
|
143,910
|
161,834
|
129,506
|
145,388
|
Median superannuation account balance
($)
|
57,883
|
45,118
|
49,413
|
56,425
|
44,634
|
49,374
|
Download data from the 2012–13 income year onward at Snapshot table 4External Link.
Chart 4: Individuals – top 10 postcodes, by average taxable income
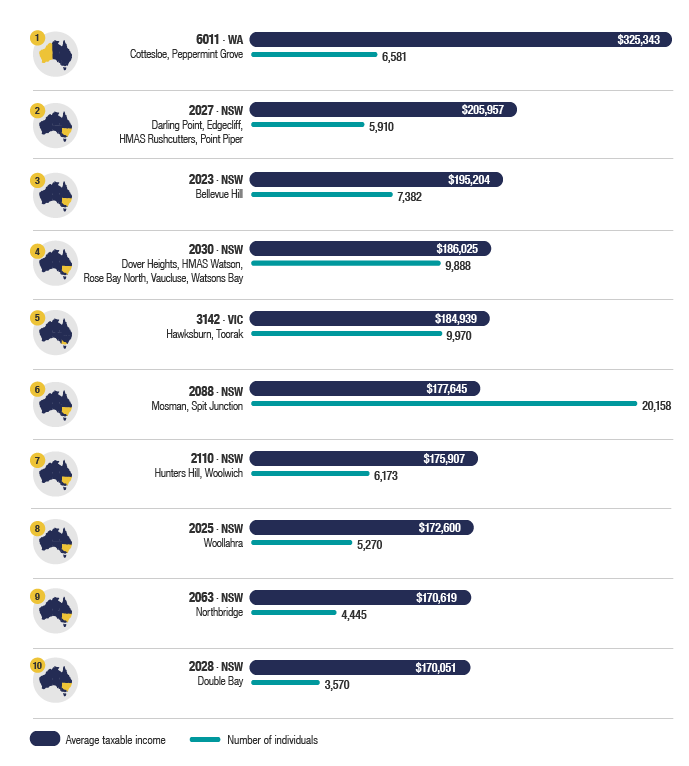
Download data from the 2010–11 income year onward at Snapshot table 5External Link.
Chart 5: Individuals – top 10 occupations, by average taxable income
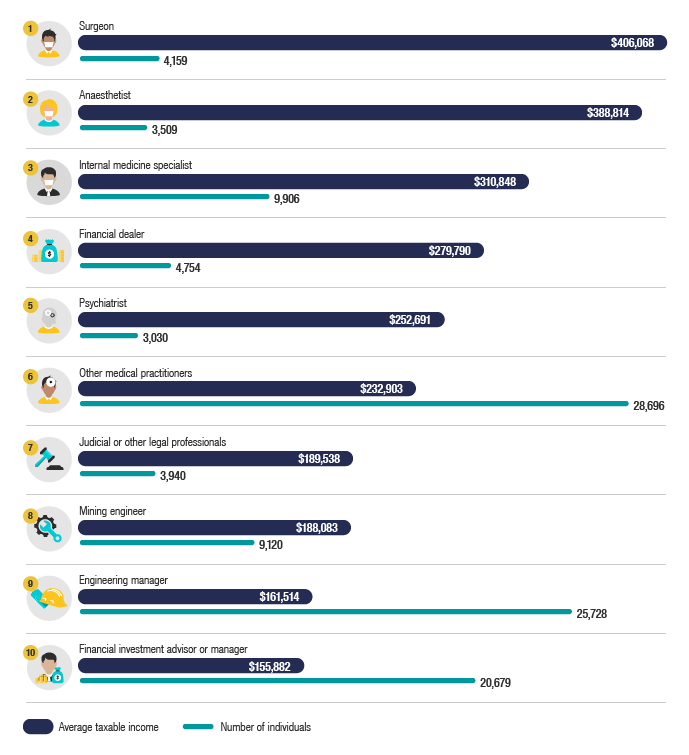
Download data from the 2010–11 income year onward at Snapshot table 5External Link.
Table 4a: Individuals – single people with private health insurance (PHI), by income tier and age, 2019–20 income year
Single people
|
Tier 0:
$90,000 or less
(no.)
|
Tier 1:
$90,001 to $105,000
(no.)
|
Tier 2:
$105,001 to $140,000
(no.)
|
Tier 3:
$140,001 or more
(no.)
|
Less than 65 years of age
|
1,207,871
|
164,220
|
216,537
|
176,445
|
65 to 69 years
|
99,478
|
6,680
|
8,356
|
7,967
|
70 years or more
|
196,377
|
6,612
|
9,087
|
15,441
|
Unspecified
|
283
|
9
|
2
|
337
|
Dependent child for PHI rebate purposes
|
413,326
|
3,775
|
2,692
|
4,074
|
Table 4b: Individuals – members of a couple with PHI, by income tier and age, 2019–20 income year
Members of a couple
|
Tier 0:
$180,000 or less
(no.)
|
Tier 1:
$180,001 to $210,000
(no.)
|
Tier 2:
$210,001 to $280,000
(no.)
|
Tier 3:
$280,001 or more
(no.)
|
Less than 65 years of age
|
2,952,108
|
507,703
|
642,143
|
568,741
|
65 to 69 years
|
353,310
|
19,574
|
24,340
|
26,125
|
70 years or more
|
510,310
|
13,952
|
18,862
|
27,516
|
Unspecified
|
79,924
|
12,233
|
14,274
|
9,308
|
In these tables, Income tier is determined by income for surcharge purposes.
Download data from the 2013–14 income year onward at Snapshot table 4External Link.
Chart 6: Individuals – net tax, by tax bracket, 2019–20 income year
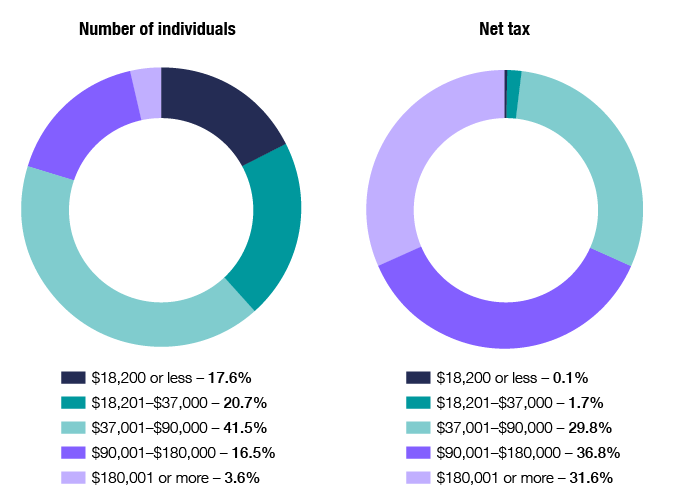
Download data from the 2010–11 income year at Snapshot table 5External Link.
Table 5: Individuals – Selected income items, 2018–19 to 2019–20 income years
Income item
|
2018–19
|
2019–20
|
Individuals
(no.)
|
Average
($)
|
Median
($)
|
Individuals
(no.)
|
Average
($)
|
Median
($)
|
Salary or wages
|
11,551,273
|
63,085
|
52,732
|
11,779,081
|
64,421
|
53,627
|
Gross interest
|
8,215,961
|
1,177
|
64
|
7,861,321
|
998
|
39
|
Allowances, earnings, tips, director’s fees etc.
|
2,666,000
|
3,539
|
417
|
3,940,637
|
3,605
|
780
|
Dividends – franked amount
|
2,834,906
|
9,656
|
568
|
2,674,671
|
9,159
|
480
|
Dividends – franking credit
|
2,827,899
|
4,009
|
245
|
2,664,405
|
3,782
|
207
|
Net rent
|
2,244,857
|
−1,352
|
−1,238
|
2,270,911
|
−73
|
−400
|
Partnerships and trusts – net non-primary production amount
|
1,831,599
|
33,046
|
5,577
|
1,862,533
|
32,578
|
4,178
|
Australian Government allowances and payments like Newstart, Youth Allowance and Austudy payment
|
933,806
|
6,451
|
5,637
|
1,674,555
|
6,569
|
5,374
|
Net income or loss from business – non-primary production
|
1,353,290
|
26,874
|
12,332
|
1,409,021
|
26,060
|
11,755
|
Dividends – unfranked amount
|
966,323
|
1,077
|
78
|
1,123,790
|
1,156
|
119
|
Net capital gain
|
744,478
|
26,446
|
1,689
|
839,950
|
24,039
|
1,670
|
Assessable foreign source income
|
795,712
|
8,582
|
400
|
828,520
|
8,864
|
384
|
Other net foreign source income
|
656,391
|
4,216
|
199
|
689,443
|
4,429
|
194
|
Australian Government pensions and allowances
|
663,999
|
12,019
|
12,575
|
683,443
|
13,016
|
13,737
|
Total income or loss
|
14,677,545
|
65,148
|
49,480
|
14,958,590
|
66,535
|
50,425
|
In this table:
- Total income or loss components don't add to the total number of individuals because individuals may declare more than one type of income
- some components of total income are not listed
- the calculations for count, average and median for total income or loss include zeros.
Download data from the 2007–08 income year onward at Snapshot table 4External Link.
Table 6: Individuals – Selected deductions, 2018–19 to 2019–20 income years
Deduction item
|
2018–19
|
2019–2020
|
Individuals
(no.)
|
Average
($)
|
Median
($)
|
Individuals
(no.)
|
Average
($)
|
Median
($)
|
Work-related expenses
|
8,888,020
|
2,331
|
1,045
|
9,395,149
|
2,303
|
1,092
|
Other expenses included in managing your tax affairs
|
5,951,011
|
332
|
176
|
5,911,137
|
333
|
180
|
Gifts or donations
|
4,210,270
|
933
|
120
|
4,337,321
|
887
|
130
|
Other deductions
|
673,191
|
3,109
|
1,706
|
681,164
|
3,314
|
1,731
|
Personal superannuation contributions
|
436,952
|
13,395
|
12,500
|
480,735
|
13,524
|
12,000
|
Dividend deductions
|
298,450
|
3,091
|
404
|
305,553
|
2,678
|
369
|
Low value pool deduction
|
274,055
|
420
|
172
|
280,784
|
396
|
168
|
Interest charged by ATO
|
233,659
|
1,464
|
262
|
193,745
|
1,602
|
372
|
Interest deductions
|
185,078
|
3,404
|
184
|
163,919
|
3,433
|
200
|
Total deductions
|
14,677,545
|
2,498
|
600
|
14,958,590
|
2,548
|
687
|
In this table:
- Other deductions is a label on the tax return and doesn't include all other deductions from the tax return not listed
- Total deductions components don't add to the total number of individuals claiming deductions because individuals may claim more than one type of deduction
- some components of total deductions are not listed
- the calculations for count, average and medians for total deductions include zeros.
Download data from the 2002–03 income year onward at Snapshot table 4External Link.
Table 7: Individuals – Selected tax offsets and levies, 2018–19 to 2019–20 income years
Offset/levy
|
2018–19
|
2019–20
|
Individuals
(no.)
|
Average
($)
|
Median
($)
|
Individuals
(no.)
|
Average
($)
|
Median
($)
|
Medicare levy
|
10,168,264
|
1,622
|
1,264
|
10,417,278
|
1,652
|
1,287
|
Low and middle income tax offset
|
9,931,612
|
747
|
954
|
10,117,963
|
748
|
951
|
Low income tax offset
|
6,768,009
|
307
|
347
|
6,787,746
|
306
|
346
|
Small business income tax offset
|
998,974
|
440
|
295
|
1,080,451
|
427
|
277
|
Commonwealth of Australia benefits and payments tax offset
|
430,560
|
691
|
688
|
687,605
|
775
|
676
|
Foreign income tax offset
|
591,696
|
1,868
|
45
|
654,222
|
1,696
|
31
|
Seniors and pensioners tax offset
|
624,458
|
1,182
|
1,167
|
639,319
|
1,193
|
1,138
|
Zone or overseas forces tax offset
|
459,137
|
315
|
132
|
442,988
|
309
|
132
|
Medicare levy surcharge
|
328,574
|
1,264
|
1,027
|
411,624
|
1,220
|
1,026
|
Employment termination payment tax offset
|
340,523
|
3,387
|
261
|
385,201
|
2,764
|
200
|
Australian superannuation income stream tax offset
|
181,999
|
3,294
|
2,794
|
167,914
|
3,497
|
3,070
|
Download data from the 2002–03 income year onward at Snapshot table 4External Link.
Chart 7: Individuals – returns by lodgment type, 2019–20 income year
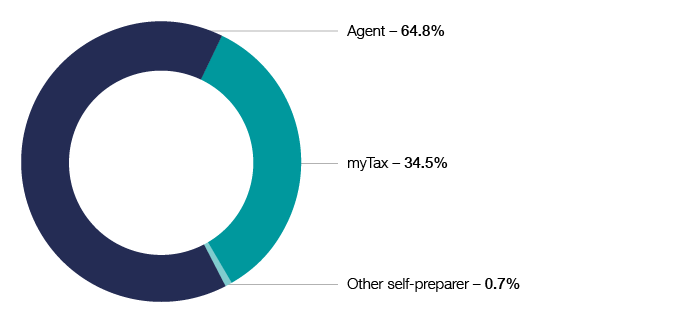
Download data from the 2009–10 income year onward at Snapshot table 5External Link.
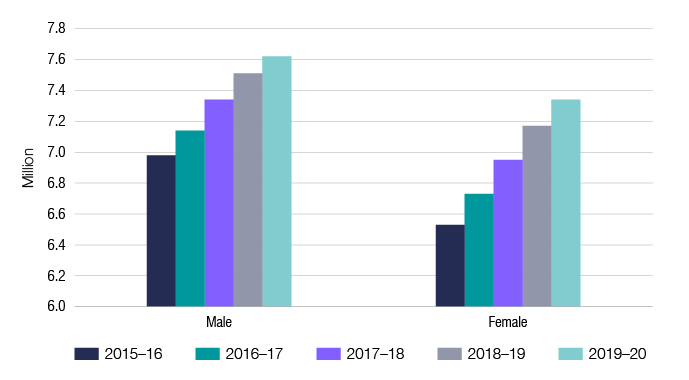
Chart 8: Individuals – returns by sex, 2015–16 to 2019–20 income years
Download data from the 2009–10 income year onward at Snapshot table 5External Link.
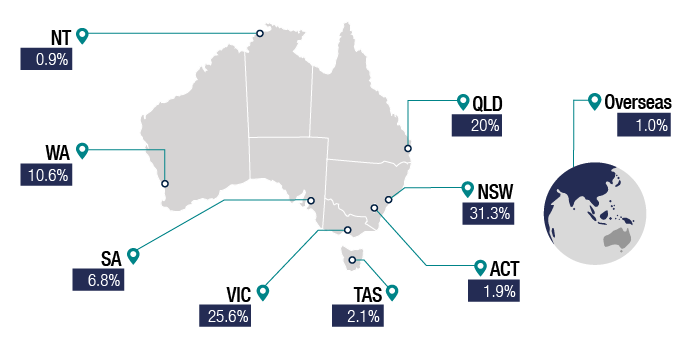
Chart 9: Individuals – returns by state/territory, 2019–20 income year
Download data from the 2009–10 income year onward at Snapshot table 5External Link.
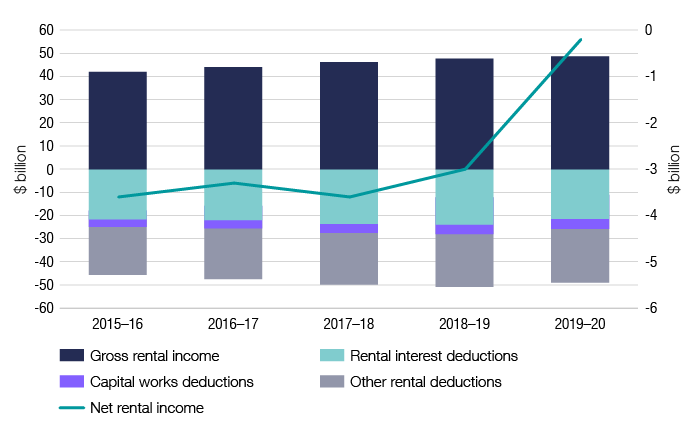
Chart 10: Individuals – rental income and deductions, 2015–16 to 2019–20 income years
Download data from the 2009–10 income year onward at Snapshot table 5External Link.
Table 8: Individuals – interest in a rental property, by overall net rent outcome, 2018–19 to 2019–20 income years
Property interests
(no.)
|
2018–19
|
2019–20
|
Net rent loss
(no.)
|
Net rent neutral/ profit
(no.)
|
Total individuals
(no.)
|
Net rent loss
(no.)
|
Net rent neutral/ profit
(no.)
|
Total individuals
(no.)
|
1
|
931,132
|
658,431
|
1,589,563
|
856,436
|
736,447
|
1,592,883
|
2
|
250,035
|
170,494
|
420,529
|
227,742
|
190,895
|
418,637
|
3
|
74,955
|
54,861
|
129,816
|
67,753
|
61,637
|
129,390
|
4
|
26,719
|
20,600
|
47,319
|
23,709
|
23,056
|
46,765
|
5
|
10,935
|
8,578
|
19,513
|
9,647
|
9,624
|
19,271
|
6 or more
|
11,226
|
9,208
|
20,434
|
9,858
|
10,037
|
19,895
|
Total
|
1,305,002
|
922,172
|
2,227,174
|
1,195,145
|
1,031,696
|
2,226,841
|
In this table, Property interests implies solely or jointly owned properties, including those bought or sold during the year.
Download data from the 1999–2000 income year onward at Snapshot table 4External Link.
Table 9: Individuals – workplace giving programs, 2017–18 to 2019–20 income years
|
2017–18
|
2018–19
|
2019–20
|
Total employees employed by workplace giving employers
(no.)
|
3,825,871
|
4,230,951
|
4,141,814
|
Employees using workplace giving
(no.)
|
181,456
|
201,237
|
211,316
|
Total donations given using workplace giving
($m)
|
38
|
43
|
52
|
Average donation
($)
|
210
|
215
|
247
|
Median donation
($)
|
75
|
75
|
100
|
In this table, individuals may be counted more than once if they changed jobs during the same income year.
Download data from the 2009–10 income year onward at Snapshot table 4External Link.
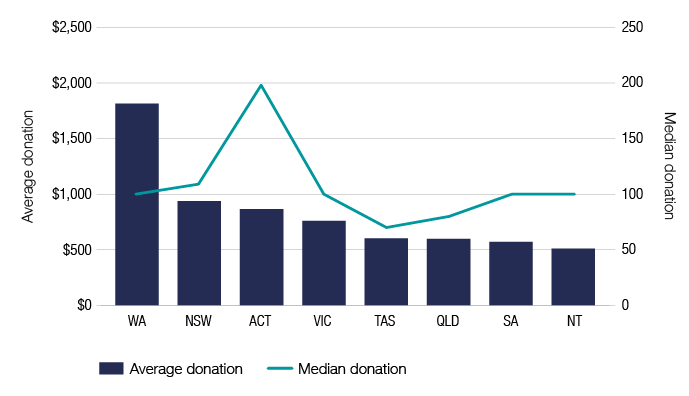
Chart 11: Individuals – gifts or donations, by state/territory, 2019–20 income year
Download data from the 2009–10 income year onward at Snapshot table 5External Link.
Chart 12: Individuals – median super balance, by age and sex, 2019–20 financial year
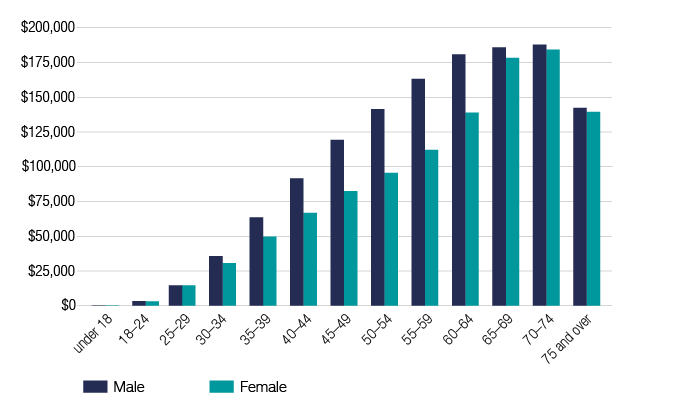
In this chart, statistics include individuals with an account balance or current year contributions greater than zero.
Download data from the 2013–14 financial year onward at Snapshot table 5External Link.
Chart 13: Individuals – super balance, by state/territory and sex, 2019–20 financial years
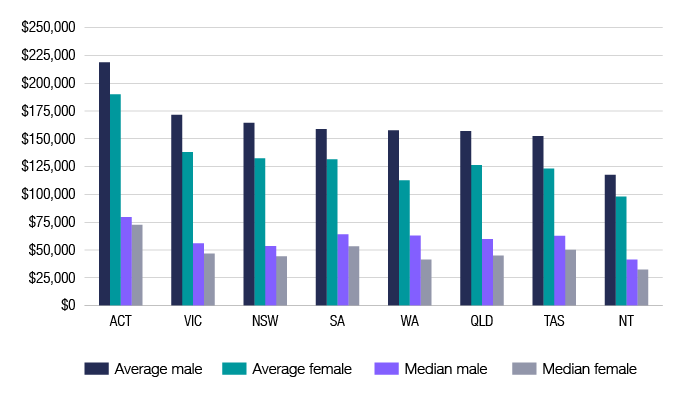
In this chart, statistics include individuals with an account balance or current year contributions greater than zero.
Download data from the 2013–14 income year onward at Snapshot table 5External Link.
Table 10: Individuals – super balance, by taxable income range, 2018–19 to 2019–20 financial years
Taxable income
|
2018–19
|
2019–20
|
Individuals
(no.)
|
Average account balance
($)
|
Median account balance
($)
|
Individuals
(no.)
|
Average account balance
($)
|
Median account balance
($)
|
Less than or equal to $18,200
|
1,979,605
|
131,629
|
19,394
|
1,938,107
|
143,479
|
19,188
|
$18,201 to $37,000
|
2,695,562
|
93,957
|
19,380
|
2,726,195
|
92,490
|
15,188
|
$37,001 to $90,000
|
5,902,727
|
121,119
|
58,841
|
6,015,386
|
116,698
|
54,365
|
$90,001 to $180,000
|
2,244,478
|
257,695
|
154,606
|
2,421,962
|
249,830
|
150,297
|
$180,001 or more
|
487,380
|
608,285
|
313,803
|
527,251
|
575,470
|
302,397
|
No tax return
|
3,670,006
|
91,799
|
15,464
|
3,508,673
|
99,468
|
20,181
|
Total
|
16,979,758
|
143,910
|
49,413
|
17,137,574
|
145,388
|
49,374
|
In this table, only individuals with a superannuation account balance greater than zero are included. The average and median are calculated excluding zeros.
Download data from the 2013–14 income year onward at Snapshot table 4External Link.
See also