Explanatory Memorandum
(Circulated by the authority of the Minister for Skills and Training, the Hon Brendan O'Connor MP)Chapter Ten: Attachments - Attachment A: Background on Australian Apprentices
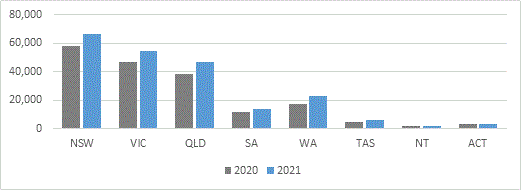
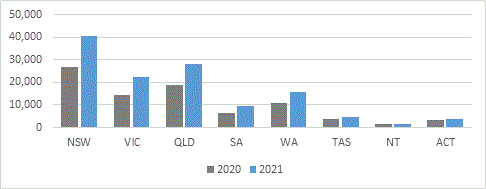
Figure 4 and Figure 5 show the number of trade and non-trade apprentices across each state and territory, comparing 2020 and 2021 data. The distribution of apprentice numbers across each jurisdiction are comparable to population data - the states with the largest populations also have the largest number of apprentices in-training. Most trade apprenticeship workplaces in Australia are located in major cities (62 per cent), with 34 per cent located in regional areas, and four per cent in remote areas. [62]
Figure 4: Trade apprentices and trainees in-training by state/territory, as of 30 June 2020 and 2021. [63]

Figure 5: Non-trade apprentices and trainees in-training by state/territory, as of 30 June 2020 and 2021. [64]

Table 9: Trade and non-trade proportions by state [65]
| Trade | Non-trade | Total | |||
| # | % | # | % | # | |
| New South Wales | 66,225 | 62.0% | 40,515 | 38.0% | 106,740 |
| Victoria | 54,325 | 70.9% | 22,295 | 29.1% | 76,620 |
| Queensland | 46,490 | 62.4% | 27,980 | 37.6% | 74,465 |
| South Australia | 13,695 | 58.5% | 9,715 | 41.5% | 23,410 |
| Western Australia | 22,745 | 59.2% | 15,655 | 40.8% | 38,400 |
| Tasmania | 6,000 | 55.3% | 4,850 | 44.7% | 10,845 |
| Northern Territory | 2,005 | 53.4% | 1,750 | 46.6% | 3,750 |
| Australian Capital Territory | 3,485 | 48.8% | 3,655 | 51.1% | 7,145 |
| Australia | 214,970 | 63.0% | 126,410 | 37.0% | 341,385 |
The split between trade and non-trade apprentices for each jurisdiction largely mirrors the national split of around 64 per cent to 36 per cent, however there are a few exceptions that could be attributed to the dominant industries and employment opportunities present in those areas. For example, both the Northern Territory (NT) and the Australian Capital Territory (ACT) have a more even split between trade and non-trade apprentices. The ACT and NT's higher non-trade Australian Apprentice count can be in large part attributed to the larger proportion of service-based industries (such as Public Administration and Safety, and Health Care and Social Assistance) in these territories.
Table 10: Number of apprentices and trainees in-training as at 30 June 2021 by occupation and state/territory. [66]
| Occupation (ANZSCO) group | NSW | VIC | QLD | SA | WA | TAS | NT | ACT | AUST |
| Managers and Professionals | 1,980 | 1,680 | 1,240 | 770 | 575 | 335 | 110 | 840 | 7,535 |
| Technicians and Trades Workers | 66,225 | 54,325 | 46,490 | 13,695 | 22,745 | 6,000 | 2,005 | 3,485 | 214,970 |
| 31 Engineering, ICT and Science Technicians | 1,445 | 1,310 | 1,585 | 445 | 865 | 205 | 55 | 150 | 6,060 |
| 32 Automotive and Engineering Trades Workers | 15,730 | 9,100 | 13,995 | 3,555 | 9,610 | 1,285 | 615 | 465 | 54,360 |
| 33 Construction Trades Workers | 21,575 | 21,710 | 12,000 | 3,540 | 3,710 | 2,315 | 435 | 1,185 | 66,465 |
| 34 Electrotechnology and Telecommunications Trades Workers | 15,475 | 10,765 | 9,770 | 3,090 | 4,845 | 780 | 595 | 985 | 46,305 |
| 35 Food Trades Workers | 3,510 | 3,615 | 2,800 | 1,060 | 1,240 | 560 | 85 | 205 | 13,065 |
| 36 Skilled Animal and Horticultural Workers | 3,180 | 3,150 | 1,655 | 680 | 480 | 210 | 50 | 185 | 9,595 |
| 39 Other Technicians and Trades Workers | 5,310 | 4,680 | 4,680 | 1,325 | 1,995 | 640 | 170 | 315 | 19,120 |
| Community and Personal Service Workers | 13,595 | 8,180 | 8,100 | 1,960 | 4,705 | 1,390 | 780 | 1,355 | 40,060 |
| Clerical and Administrative Workers | 9,895 | 4,725 | 7,960 | 2,440 | 3,540 | 1,405 | 265 | 785 | 31,010 |
| Sales Workers | 7,535 | 2,960 | 3,300 | 2,195 | 1,725 | 680 | 230 | 265 | 18,890 |
| Machinery Operators and Drivers | 3,795 | 1,705 | 4,790 | 875 | 3,185 | 475 | 155 | 220 | 15,195 |
| Labourers | 3,710 | 3,050 | 2,595 | 1,475 | 1,925 | 565 | 210 | 185 | 13,715 |
| Total | 106,740 | 76,620 | 74,465 | 23,410 | 38,400 | 10,845 | 3,750 | 7,145 | 341,385 |
In 2021, 27.4 per cent of employers had apprentices or trainees [67] . The majority of Australian Apprenticeships are offered by small to medium sized businesses who employed around 71 per cent of apprentices as at 30 June 2021. [68]
Australian Apprenticeships range from Certificate II up to Advanced Diploma level in more than 500 occupations across Australia. Positions are available in traditional trades, as well as a diverse range of emerging careers. An Australian Apprenticeship can take between one and four years to complete, depending on the type of program and qualification. Tables 11 and 12 show the top five increasing trade and non-trade occupations for apprenticeship commencements in 2020-2021.
Table 11: Top five increasing trade occupations for Australian Apprentices (June 2020 - June 2021)
| ANZSCO minor occupation | 2020 | 2021 | Increase | Per cent |
| 331 Bricklayers, and Carpenters and Joiners | 30,360 | 36,100 | 5,745 | 18.9% |
| 341 Electricians | 32,300 | 36,220 | 3,920 | 12.1% |
| 321 Automotive Electricians and Mechanics | 24,545 | 28,190 | 3,645 | 14.8% |
| 334 Plumbers | 18,565 | 20,975 | 2,405 | 13.0% |
| 351 Food Trades Workers | 10,955 | 13,065 | 2,110 | 19.3% |
Table 12: Top five increasing non-trade occupations for Australian Apprentices (June 2020 - June 2021)
| ANZSCO minor occupation | 2020 | 2021 | Increase | Per cent |
| 512 Office and Practice Managers | 2,895 | 8,395 | 5,500 | 189.9% |
| 531 General Clerks | 6,960 | 12,380 | 5,420 | 77.9% |
| 431 Hospitality Workers | 7,690 | 12,005 | 4,320 | 56.2% |
| 621 Sales Assistants and Salespersons | 10,525 | 14,350 | 3,830 | 36.4% |
| 421 Child Carers | 10,880 | 14,540 | 3,660 | 33.7% |
